
- Overview
- Lesson Preview
- Teaching Materials
- Extensions
- Background
- Learning Standards
- Feedback
- Credits
- Acknowledgments
- Version Notes
- Overview
- Lesson Preview
- Teaching Materials
- Extensions
- Background
- Learning Standards
- Feedback
- Credits
- Acknowledgments
- Version Notes
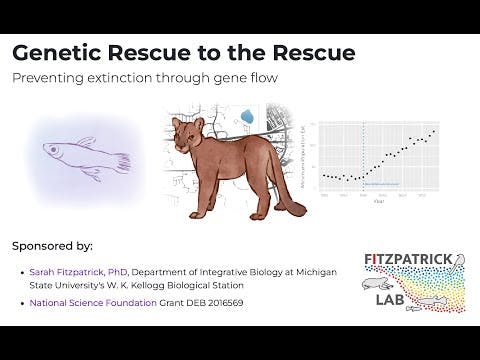
Genetic Rescue to the Rescue
Preventing extinction through gene flow
Sponsored by:
- Sarah Fitzpatrick, PhD, Department of Integrative Biology at Michigan State University's W. K. Kellogg Biological Station
- National Science Foundation Grant DEB 2016569
The Gist:
Students will deepen their understanding of basic genetics concepts as they dive into real data sets from ongoing research. They will hone critical thinking and communication skills and come away with clear examples of how science can lead to positive impacts on wildlife populations.
Target Subject:
Grades:
Estimated Time:
Target Subject:
ScienceGrades:
9-12Estimated Time:
5 x 45 min
Subject breakdown by standard alignments
Driving Question(s):
Can genetic rescue (a conservation strategy involving movement of individuals across populations) prevent the extinction of endangered species?
Essential Question(s):
How do we use scientific methods to measure and develop solutions for our negative impacts on the world?
Hook(s):
Numerous puzzles, group activities, compelling videos, and active discussions draw students into real world problems.
Keywords:
genetic rescuegeneticsconservationfishcatnatural selectionvariationevolutionextinction“Teach it in 15” Quick Prep
- Check out lesson multimedia below
- Look over Teaching Materials
- Teach it and let us know what you think!
The Return of The Florida Panther
Emotional engagement hook for the unit. Provides background on the plight of Florida panthers, and fodder for classroom discussion.
Are endangered species worth saving?
Gets students thinking about the costs of losing a species to set the stakes for a role play scenario.
What is genetic rescue, and can we use it to save endangered species?
Summarizes key learning objectives from Parts 1-3, and provides deeper context around genetic rescue, its potential risks, and benefits.
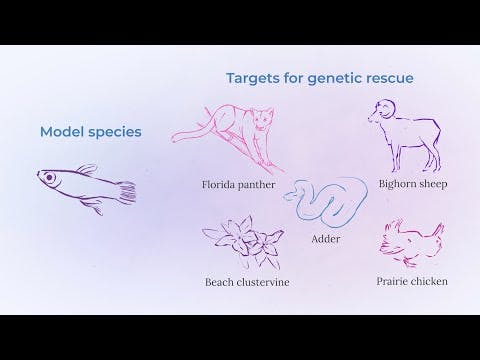
Saving a species through genetic rescue: Why we need model organisms
Dr. Sarah Fitzpatrick explains how her research on guppies applies to conservation of endangered species like Florida panthers.
A virtual PD/walk-through of the lesson
GP Founder Matt Wilkins breaks down how this lesson can be used in your classroom.

3 x 45 min
Available Grade Bands
Available Teaching Environments
Learning Objectives
Students will able to...
Provide examples of variation in genes, traits, and individual survival, and why each is important for a species to persist and evolve.
Summarize how human activities fragment animal populations and how habitat fragmentation limits gene flow, reducing genetic variation.
Create a logic model showing how genetic rescue occurs; i.e. how the introduction of new individuals to a small, inbred population can prevent extinction.
Materials for Grades 9-12
Presentation (Part 1)
Need: WiFi, Computer, Projector, Sound
Student Worksheet (Part 1)
Print 1 Per Student
Teacher Worksheet (Part 1)
Print 1
Steps & Flow
5 min: Warm-Up
5 min: Warm-Up
1.Polymath Puzzle #1
Polymath Puzzle #1
1.Polymath Puzzle #1
Polymath Puzzle #1
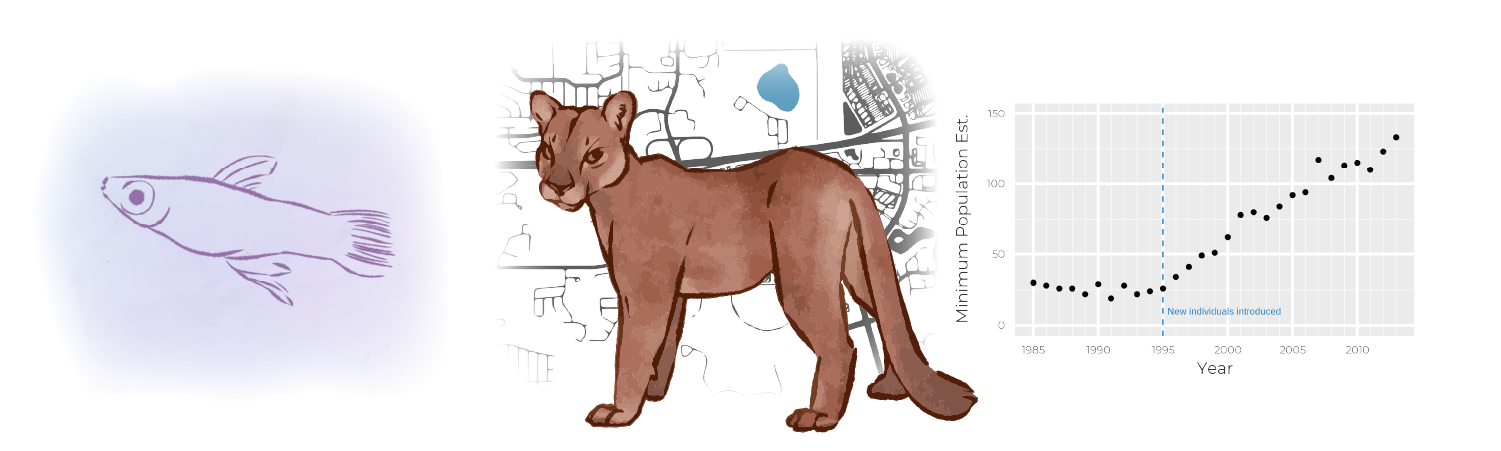
What Question are we Investigating?
Students interpret a series of images (rebus puzzle) to determine the focus of this lesson.
- subspecies: a distinct population of a species, typically due to geographic isolation
This type of puzzle is called a rebus.
5 min: Meet the Florida Panther
5 min: Meet the Florida Panther
2.Scientific vs. Common Names
Scientific vs. Common Names
2.Scientific vs. Common Names
Scientific vs. Common Names
Brief intro to Genus and species and why scientific names avoid confusion around common names.
What we call a "panther" actually means a lot of different, very distinct types of cat.
- scientific name: the Genus + species of an organism
- common name: a local name for an organism
- panther: can refer to 1) a dark variety of a jaguar or leopard or 2) the Florida subspecies of the Puma or mountain lion
3.Florida Panther history
Florida Panther history
3.Florida Panther history
Florida Panther history
A very brief history of how these great cats were hunted and driven to the brink of extinction.
15 min: Exploring Panther Perspectives
15 min: Exploring Panther Perspectives
4.Watch Video 1
Watch Video 1
4.Watch Video 1
Watch Video 1
How do people feel about the Florida Panther?
▶ The Return of The Florida Panther explores the plight of the panther through the lens of different stakeholders (e.g. urbanites, ranchers, and Native Americans).
5.Reflection + Discussion
Reflection + Discussion
5.Reflection + Discussion
Reflection + Discussion
Students Think+Ink+Share what they noticed/inferred from the video about why different groups like or dislike panthers.
6.Let's review a scene
Let's review a scene
6.Let's review a scene
Let's review a scene
Students reflect on a scene where a man compares the loss of panthers to loss of Master Art Works.
20 min: What Happens if we Lose the Florida Panther?
20 min: What Happens if we Lose the Florida Panther?
7.On the Brink of Extinction
On the Brink of Extinction
7.On the Brink of Extinction
On the Brink of Extinction
Students spend rest of class period reflecting on different impacts of losing Florida panthers.
Students work with a partner, in a group, or individually, as you prefer to fill out a table with biological, social, and economic impacts caused by the extinction of Florida panthers. After sharing/discussing as a class, they spend the rest of class reflecting individually about different stakeholder perspectives and summarizing take-homes.
- inbred: the product of mating with closely related individuals; often results in individuals with genetic disorders
- inbreeding: a condition that occurs when genetically closely related animals mate, especially over multiple generations
Learning Objectives
Students will able to...
Provide examples of variation in genes, traits, and individual survival, and why each is important for a species to persist and evolve.
Summarize how human activities fragment animal populations and how habitat fragmentation limits gene flow, reducing genetic variation.
Demonstrate understanding of how reduction in both population size and genetic variation in endangered species lead to the "extinction vortex"—the increasing likelihood of small populations to blink out due to low population size and recessive genetics from inbreeding.
Materials for Grades 9-12
Panther Genotype Cards for Hands On Simulation of Genetics of Inbreeding in Panthers (Part 2)
Print a set for every ~10 students and put Big and Small cards in separate envelopes
Presentation (Part 2)
Need: WiFi, Computer, Projector, Sound
Student Worksheet (Part 2)
Print 1 Per Student
Teacher Worksheet (Part 2)
Print 1
Steps & Flow
5 min: Warm-Up
5 min: Warm-Up
1.Polymath Puzzles Set #2
Polymath Puzzles Set #2
1.Polymath Puzzles Set #2
Polymath Puzzles Set #2
Students solve two puzzles which demonstrate the meaning of biological traits and how these translate into genetic variation.
For Polymath Puzzle #1, students look at a series of shapes with different patterns and colors and they must count how many different "traits" can be observed. For puzzle #2, students are shown two groups of traits and they must decide which group exhibits greater variation.
- trait: a specific characteristic of an organism
- variation: any difference in organisms caused by genetic and/or environmental differences
20 min: Genetics Mini-Review: Unhealthy Cats
20 min: Genetics Mini-Review: Unhealthy Cats
2.Genetics Mini-Review
Genetics Mini-Review
2.Genetics Mini-Review
Genetics Mini-Review
Students go through a quick review of dominant and recessive alleles.
Spend some time going through the slides with students to ensure a solid understanding of dominant and recessive traits. These form the basis of why the Florida Panther is experiencing genetic crisis.
- nucleotide: one of 4 chemical building blocks of DNA; abbreviated as A, C, G, and T
- allele: different forms of a gene
- dominant: when a trait is still functional even if one allele is defective
- recessive: when a trait is only expressed when an individual has two copies of the allele
- genotype: the combination of alleles an individual has for a set of genes
- phenotype: the combined effect of genes to produce a trait
20 min: Recessive Traits Activity
20 min: Recessive Traits Activity
3.Understanding Inbreeding
Understanding Inbreeding
3.Understanding Inbreeding
Understanding Inbreeding
How does population size affect how common recessive traits are?
In this activity, students simulate matings between panthers in a small and a large population. The slides guide students through understanding the 3 traits that we will be studying: kinked tails (a bone defect), a heart defect (where kittens are born with a hole in the septum), and cowlick (a strange pattern in the fur). By simulating matings in a large population (where recessive traits will be less common) and a small population (which parallels inbreeding in endangered populations), students should recognize how population size affects overall health of a species.
- inbreeding: a condition that occurs when genetically closely related animals mate, especially over multiple generations
4.Small Population Simulations
Small Population Simulations
4.Small Population Simulations
Small Population Simulations
Students should work in groups to fill out their worksheets.
Each group should have 2 envelopes with cutouts of 15 panther cards (1 set sampled from a small population; 1 sampled from a big population). Students start by drawing a pair of parents from the small population. They fill in Table 1, practicing with assigning genotypes and phenotypes.
A pair of groups can share a set of envelopes to save you time and paper.
5.Small Population Mating
Small Population Mating
5.Small Population Mating
Small Population Mating
With Steps 7-8, students randomly select alleles to pass on and describe phenotypes of offspring.
If a parent is homozygous (e.g. TT or tt), they only have one allele to pass on. In cases of heterozygous parents (Tt), you can have students flip a coin to determine which allele gets passed on.
6.Learn, Practice, Repeat
Learn, Practice, Repeat
6.Learn, Practice, Repeat
Learn, Practice, Repeat
Once the worksheet has walked students through the process, they simulate 5 more matings.
First students fill out Table 3, with three matings (parent and offspring genotypes), counting up recessive phenotypes. They then do the same thing in Table 4, drawing cards from the "Big Population," which has many fewer recessive genotypes.
7.Combine Data
Combine Data
7.Combine Data
Combine Data
Once groups have finished simulating matings in both populations, they combine data as a class.
You will need to have Table 5 drawn on the board (or use a spreadsheet) to allow groups to record their data.
Look out for errors: small population matings should have many more recessive genotypes than big population matings.
8.Independent Analysis
Independent Analysis
8.Independent Analysis
Independent Analysis
Students copy down other groups' data in Table 5
Students will then calculate the total number of recessive phenotypes out of the total possible to get a percentage. They should then reflect on why the percentage of recessive traits is higher in the small population and why it is important.
Learning Objectives
Students will able to...
Provide examples of variation in genes, traits, and individual survival, and why each is important for a species to persist and evolve.
Demonstrate understanding of how reduction in both population size and genetic variation in endangered species lead to the "extinction vortex"—the increasing likelihood of small populations to blink out due to low population size and recessive genetics from inbreeding.
Assess the potential risks and benefits of genetic rescue for a particular species, and propose a course of action.
Materials for Grades 9-12
Presentation (Part 3)
Need: WiFi, Computer, Projector, Sound
Student Worksheet (Part 3)
Print 1 Per Student
Teacher Worksheet (Part 3)
Print 1
Steps & Flow
6 min: Engagement
6 min: Engagement
1.Watch Video
Watch Video
1.Watch Video
Watch Video
Students watch ▶ Are endangered species worth saving? to get them thinking about what is at stake.
Students are not asked anything about the video by default, but you might ask students to quickly think-pair-share an answer to the question: "Are endangered species worth saving?"
20 min: Role Play: What to do about the Florida Panther?
20 min: Role Play: What to do about the Florida Panther?
2.Brainstorming
Brainstorming
2.Brainstorming
Brainstorming
Students simulate being on a committee in 1994 that will decide what to do about Florida Panthers.
Divide students into 3 groups and assign each a different option to advocate: let nature run its course; start a captive breeding program; or use genetic rescue. Allow groups 5-10 minutes to brainstorm the pros and cons of their arguments and fill out questions 1 & 2 on the worksheet.
- captive breeding: breeding in zoos and aquariums of plants or animals to maintain populations
For a large class, you can have multiple sets of 3. (e.g. have students number of 1-3, and have 3 group stations for the front half and 3 group stations for the back half of the room)
3.Explore
Explore
3.Explore
Explore
Gallery Walk
Groups observe what others worked on and finish by returning to their own group and finishing the worksheet based on what they learned.
You can choose whether the gallery walk should be "as a group" or individually paced.
19 min: Share Out! Pros/Cons of Saving the Florida Panther
19 min: Share Out! Pros/Cons of Saving the Florida Panther
4.Class Discussion
Class Discussion
4.Class Discussion
Class Discussion
Each group will have the opportunity to share the pros & cons they brainstormed for each committee scenario.
Write or type the pros & cons on three large charts for each scenario based on the students' input. Once all three options have been discussed, each student gets to vote on a course of action. Ask students to provide evidence and reasoning to support their choice.
If you want to bring in some technology, you could add (or ask students to add) observations to a Google Jamboard or Padlet.
5.Scaffolding
Scaffolding
5.Scaffolding
Scaffolding
Slides go over the major pros & cons for each scenario, in case anything was missed.
6.Vote!
Vote!
6.Vote!
Vote!
Ask students to vote on a course of action
Ask them to provide evidence and reasoning to support their choice.
7.Students Finish Worksheet on their Own
Students Finish Worksheet on their Own
7.Students Finish Worksheet on their Own
Students Finish Worksheet on their Own
Can be assigned for homework
Learning Objectives
Students will able to...
Provide examples of variation in genes, traits, and individual survival, and why each is important for a species to persist and evolve.
Predict how increasing genetic variation by introducing new individuals (i.e. by conducting genetic rescue) will impact population size.
Demonstrate understanding of how reduction in both population size and genetic variation in endangered species lead to the "extinction vortex"—the increasing likelihood of small populations to blink out due to low population size and recessive genetics from inbreeding.
Propose a model organism to use for research on species that are endangered or infeasible to study.
Materials for Grades 9-12
Presentation (Part 4)
Need: WiFi, Computer, Projector, Sound
Student Worksheet (Part 4)
Print 1 Per Student
Teacher Worksheet (Part 4)
Print 1
Steps & Flow
10 min: Background/ Engage
10 min: Background/ Engage
1.Overview
Overview
1.Overview
Overview
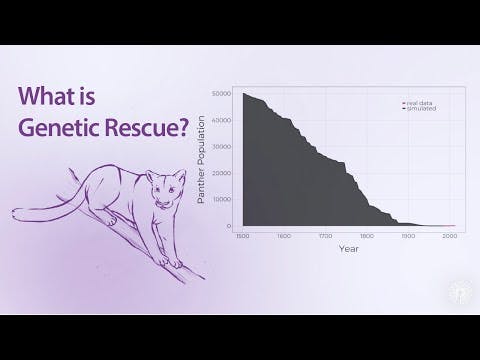
Students watch part of ▶ What is genetic rescue, and can we use it to save endangered species? to review and go deeper into what genetic rescue is and why it is so important for a population to have genetic variation.
- habitat fragmentation: the process of breaking a habitat up into disconnected pieces
20 min: Elaborate
20 min: Elaborate
2.The Extinction Vortex
The Extinction Vortex
2.The Extinction Vortex
The Extinction Vortex
Students continue watching ▶ What is genetic rescue, and can we use it to save endangered species? to learn more about what an extinction vortex is and how populations can be saved from this circumstance.
They are then asked to fill out a concept map to demonstrate understanding of the Extinction Vortex. The slides then walk through a discussion of the logic behind the correct concept map.
- extinction: the dying out of a species due to environmental or evolutionary changes
- concept map: a diagram that shows how different inputs or parts of a system affect each other
3.Genetic Rescue Concept Mapping
Genetic Rescue Concept Mapping
3.Genetic Rescue Concept Mapping
Genetic Rescue Concept Mapping
Students work in pairs to fill out a scaffolded concept map of Genetic Rescue
Encourage a group to share their answer and the process for figuring it out. Walk through the logic as a class.
- genetic rescue: introducing individuals with new genetic variation to help a population recover from inbreeding
4.Pivot to Model Organisms
Pivot to Model Organisms
4.Pivot to Model Organisms
Pivot to Model Organisms
Students finish the video, explaining how genetic rescue can go wrong.
Students are asked to study a table of organisms to determine which would be good and which would be bad models to use in studies of genetic rescue.
- model organism: a species used to study a problem when it is difficult or impossible to study in a target species
15 min: Independent Reflection
15 min: Independent Reflection
5.Students Finish Worksheet on their Own
Students Finish Worksheet on their Own
5.Students Finish Worksheet on their Own
Students Finish Worksheet on their Own
Students pick a model species to study genetic rescue from the table of options.
Learning Objectives
Students will able to...
Provide examples of variation in genes, traits, and individual survival, and why each is important for a species to persist and evolve.
Predict how increasing genetic variation by introducing new individuals (i.e. by conducting genetic rescue) will impact population size.
Interpret scatter plot data from a model organism (guppies) and compare to related data in an endangered species (Florida panthers).
Materials for Grades 9-12
Presentation (Part 5)
Need: WiFi, Computer, Projector, Sound
Student Worksheet (Part 5)
Print 1 Per Student
Teacher Worksheet (Part 5)
Print 1
Steps & Flow
5 min: Review
5 min: Review
1.Genetic Rescue in Action
Genetic Rescue in Action
1.Genetic Rescue in Action
Genetic Rescue in Action
Students review the end of ▶ What is genetic rescue, and can we use it to save endangered species? and go over the previous day's worksheet.
Tortoises are the only bad option listed, as they have a slow generation time and are not common. The other species are all actual models for genetic rescue research.
5 min: Dr. Sarah Fitzpatrick Talks About her Research
5 min: Dr. Sarah Fitzpatrick Talks About her Research
2.Hear it from a Scientist!
Hear it from a Scientist!
2.Hear it from a Scientist!
Hear it from a Scientist!
Dr. Fitzpatrick, whose research forms the basis of this lesson, discusses how she has studied genetic rescue using Trinidadian Guppies (fish) in ▶ Saving a species through genetic rescue: Why we need model organisms.
15 min: Quick Activity
15 min: Quick Activity
3.Instant Peer Review
Instant Peer Review
3.Instant Peer Review
Instant Peer Review
Students compare and contrast guppies and panthers on their worksheets (Q1-4).
They then switch papers with a partner. They should underline a point they strongly agree with, circle a point they disagree with or think should be explained better, and discuss. Then revise based on the feedback. Students can then share positive/helpful feedback they received.
4.Scaffolding
Scaffolding
4.Scaffolding
Scaffolding
Slides walk through the primary responses students should have come up with.
10 min: Analyzing Real Data
10 min: Analyzing Real Data
5.Developing Predictions
Developing Predictions
5.Developing Predictions
Developing Predictions
Students revisit the genetic rescue concept map and think about what they could measure to assess success.
Specifically, we expect that if genetic rescue is successful:
- genetic variation should increase and
- as a result population size should increase (because of higher survival and reproduction)
6.Independent Analysis
Independent Analysis
6.Independent Analysis
Independent Analysis
Students spend the rest of class filling out the worksheet on their own.
They are asked to label graphs from Florida panthers and guppies by carefully studying part of the data table used to generate them.
If students are confused, ask them to notice anything at all about the tables. Do some of the numbers or dates seem to match up with any of the graphs?
7.Independent Reflection
Independent Reflection
7.Independent Reflection
Independent Reflection
Students generate a question from the data and synthesize their findings and observations to make a recommendation.
Given the evidence from Florida panther recovery and the study in Trinidadian guppies, should we conduct a second genetic rescue attempt in the panthers?
Materials for Grades 9-12
Student Assessment
Teacher Assessment
Genetic Rescue Unit Assessment Rubric
One exciting extension could be to have students investigate map data of panther car collision mortality events over time. This incredible interactive web tool would allow students to conduct an independent investigation of the leading cause of Florida panther mortality (car crashes). Students could be asked to develop their own recommendation for mitigation (a wildlife overpass, increased signage, or decreased speed limit) on specific roadways that show high numbers of collisions.
Connection to Research
How do we save endangered species? This lesson deals with one option called genetic rescue—a conservation strategy that involves moving individuals from one population into an endangered population that is highly inbred in order to add genetic variation to enable population recovery. Students learn about two distinct lines of research: one measuring the success of an attempt to save endangered Florida panthers; the other using wild Trinidadian guppies as a model of endangered species in order to better understand details of how genetic rescue can succeed or fail.
Research Background
Watch this video for a lot of panther background: ▶ What is genetic rescue, and can we use it to save endangered species?
The Florida panther is a unique subspecies (Puma concolor coryi) of the American puma (Puma concolor). It's not to be confused with black panthers, which are the dark (melanistic) forms of leopards or jaguars. The Florida panther was nearly driven to extinction by habitat loss, fragmentation, and targeted hunting. In the mid-1990s, there remained only a tiny ~20 individual population of panthers in south Florida, and they were highly inbred. They had a lot of recessive genetic abnormalities, including visible, superficial traits like: kinked tails and cowlicks in their fur, to more significant problems like: cryptorchidism (undescended testicles, causing infertility in males) and heart defects. Wildlife managers decided to relocate 8 female pumas from Texas (Puma concolor couguar) into Florida to introduce needed genetic variation.
Students will get to analyze 20 years worth of monitoring data to assess whether genetic rescue was successful (it was! There are now over 200 Florida panthers). At the same time, students will compare these results to a paired data set in Trinidadian guppies to understand how model organisms can be used to answer scientific questions that are difficult to answer in an endangered or difficult-to-study species.
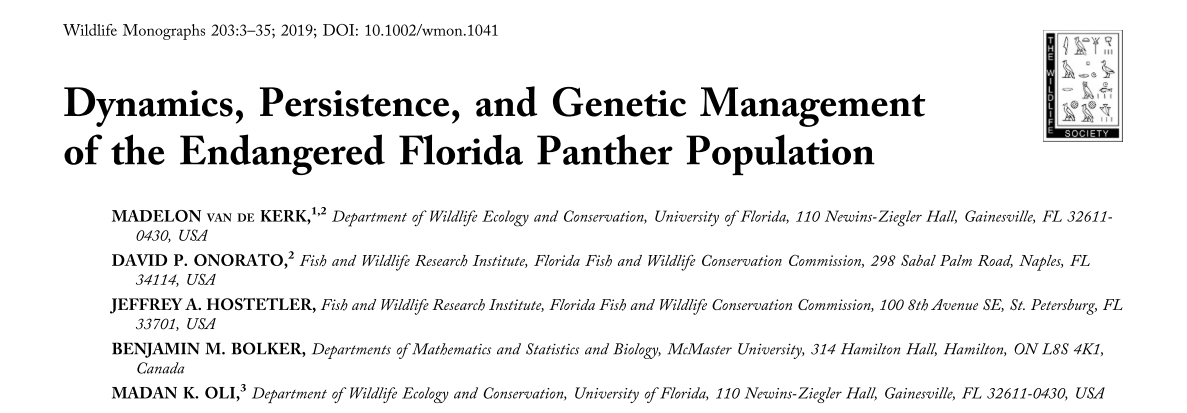
Related Florida Panther Paper:
This video connects genetic rescue research on Florida panthers to the Trinidadian guppy model species: ▶ Saving a species through genetic rescue: Why we need model organisms
To study many details of genetic rescue in a model system where we don't have to worry about inadvertently driving a species extinct, Dr. Sarah Fitzpatrick and colleagues went to Trinidad. They took advantage of previous experiments that had moved guppies from a downstream population that had lots of genetic variation into upstream pools with only a few, highly inbred fish.
This genetic rescue experiment was indeed successful, and after only a few months, genetic variation increased and the population rebounded from around 20 individuals to over 1,000.
Related Guppy Paper:

Further Reading
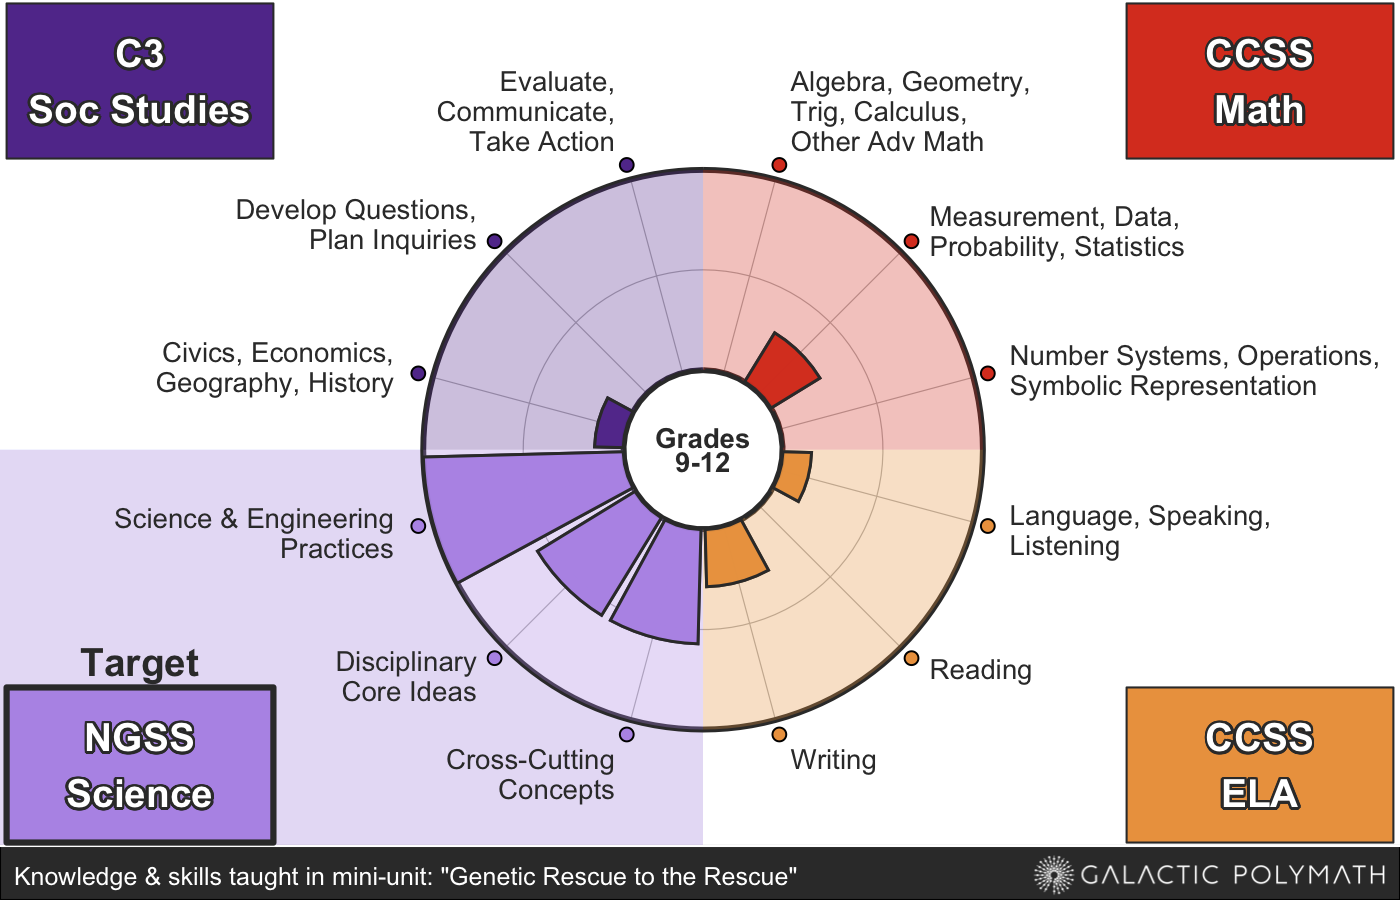
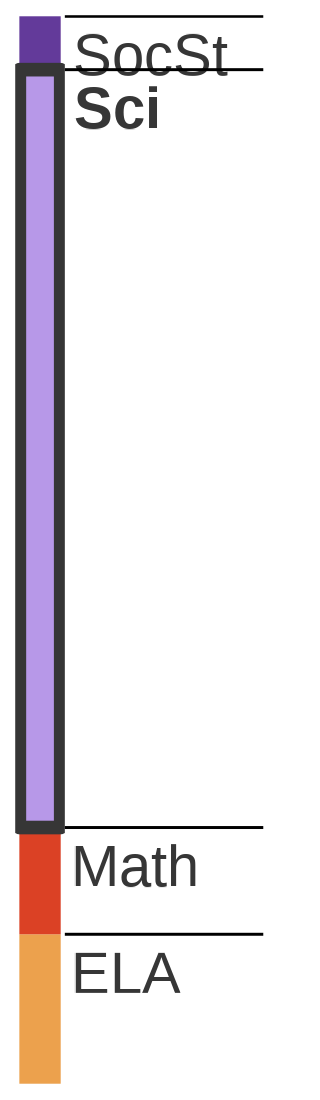
This Galactic Polymath Learning Chart illustrates the areas of knowledge covered. This lesson targets Science, but it helps teach national learning standards in 4 subjects:
- Common Core Math; Common Core ELA; Next Generation Science (NGSS); and College, Career, and Civic Life (C3) Social Studies Standards. In total, there are 21 standards across US grade band(s): 9-12.
Target Standard(s)
Dimension: Science & Engineering Practices
How does the lesson address this standard?
Students take part in a role-playing activity where they consider three options for how to address the issues with Florida Panthers and discuss the pros and cons of each.
How does the lesson address this standard?
Students take part in a role-playing activity where they consider three options for how to address the issues with Florida Panthers and discuss the pros and cons of each.
How does the lesson address this standard?
Students interpret graphs depicting Trinidadian guppies' population size and genetic variation over time to determine success of genetic rescue treatment.
How does the lesson address this standard?
- Students will complete a worksheet that asks them to identify a graph that depicts a population undergoing an extinction vortex and explain their choice by comparing it to another graph.
- Students also complete concept maps to communicate their understanding of extinction vortex and genetic rescue.
Dimension: Disciplinary Core ideas
How does the lesson address this standard?
Look at genetic variation at different scales in Parts 1 and 2.
How does the lesson address this standard?
Students participate in a simulated breeding activity, deepening their understanding of the genotype -> phenotype connection.
How does the lesson address this standard?
Students explore the extinction vortext concept by reviewing and comparing multiple graphs that show changes in population size (and genetic variation) over time.
Dimension: Cross-Cutting Concepts
How does the lesson address this standard?
Students will evaluate the characteristics of a variety of commonly used model organisms and select the ones that best fit for studying the problem in Florida panthers
How does the lesson address this standard?
Students will evaluate the characteristics of a variety of commonly used model organisms and select the ones that best fit for studying the problem in Florida panthers.
How does the lesson address this standard?
Students will evaluate the characteristics of a variety of commonly used model organisms and select the ones that best fit for studying the problem in Florida panthers.
Connected Standard(s)
Dimension: Measurement, Data, Probability & Statistics
How does the lesson address this standard?
Students will interpret population data from Trinidadian guppies and use their findings to explain how it models changes in the Florida Panther population after genetic rescue has occured.
How does the lesson address this standard?
Students will interpret population data from Trinidadian guppies and use their findings to explain how it models changes in the Florida Panther population after genetic rescue has occured.
Dimension: Writing
How does the lesson address this standard?
Students use information to complete a logic model depicting genetic rescue.
How does the lesson address this standard?
Students take part in a role-playing activity where they consider three options for how to address the issues with Florida Panthers and discuss the pros and cons of each.
Dimension: Language, Speaking & Listening
How does the lesson address this standard?
Students integrate graphs, video, and classroom discussions and reflections to enhance understanding of genetic rescue.
Dimension: Science & Engineering Practices
How does the lesson address this standard?
Students take part in a role-playing activity where they consider three options for how to address the issues with Florida Panthers and discuss the pros and cons of each.
How does the lesson address this standard?
Students take part in a role-playing activity where they consider three options for how to address the issues with Florida Panthers and discuss the pros and cons of each.
How does the lesson address this standard?
Students will interpret population data from Trinidadian guppies and use their findings to explain how it models changes in the Florida Panther population after genetic rescue has occured.
Dimension: Disciplinary Core ideas
How does the lesson address this standard?
Students watch videos to learn about the benefits provided by a healthy Florida Panther population and participate in a Think-Pair-Share to discuss the potential impacts of losing Florida Panthers.
Dimension: Cross-Cutting Concepts
How does the lesson address this standard?
Students will interpret population data from Trinidadian guppies and use their findings to explain how it models changes in the Florida Panther population after genetic rescue has occured.
Please let us know how it went with your class!
We want to know what you (and/or your students) think!
Share your feedback in < 5 min with these forms:
Lead Author and Creative Director:
Matt Wilkins, PhD If you liked this lesson, please help spread the word! Feel free to tag me (@mattwilkinsbio) and GP (@galacticPM) on Twitter with your experiences and student questions!
And please sign up for our mailing list to hear what’s coming up next!
Sponsor and Producer
Animation and Video Editing:
Narration and Scoring:
Stephanie Castillo (aka Phuture Doctors)
Education Consultants:
Data
Provided Florida panther data and expert feedback on Florida panther conservation
- Madelon van de Kerk, PhD | Assistant Professor, Western Colorado University Gunnison, Colorado, USA
"Return of the Panther" Video
For more, amazing videos like this, check out Chris's YouTube channel!
- Chris Morgan | Filmmaker, bear ecologist, Wildlife Media
"Are endangered species worth saving?" Video
Check out other fun, thought-provoking videos at Above the Noise!
- Myles Bess and team | , Above the Noise
Photo of Black Panthers
"Keira & Neron Jaguars" in Part 1 Presentation
- Alma Leaper | Lead Photographer, The Big Cat Sanctuary UK
Major Release Beta
0.1.0 Initial lesson build.
12/9/2021
0.1.1 minor update
12/12/2021
Fixed version number issue & added Video Links to Teach it in 15 Quick Prep
0.2.0 Updated data & added lesson media browser
12/13/2021
Acknowledgments
Thanks to Kenzie Bottoms for making the media browser magic!
0.3.0 Major revisions to Part 3
2/17/2022
Added new Above the Noise video engagement at the beginning & numerous tweaks to presentation and worksheet to improve flow & aid student understanding.
0.4.0 Major updates to documentation
3/3/2022
Added more background information & the extensions section
0.5.0 Added assessments to lesson
8/25/2022
A pre-/post- test assessment tool
0.6.0 Rebuilt for galacticpolymath.com relaunch
5/5/2023